110,702 new cars were registered as sold across the month throughout the country, which was 18.3% higher than the sales recorded over the same period last year. September’s strong result continues the upward trend of results seen in August (15.4%) and July (14.7%).
This rich vein of form for the industry has meant that the total number of car sales for the year to date (YTD) has reached just shy of 900,000 nationwide at the end of the third quarter (899,286), marking an improvement of 10.9% compared to the figures at the equivalent point in 2022 (811,130).
The increase in car sales and fulfilled orders is indicative of the continued improvement of vehicle supply, making it easier for Australians around the country to get their hands on the new car they’re after.
This is extended to electric and electrified vehicles, which made up 18.3% of all sales across the month (with 8.0% of these coming purely from battery electric cars).
It was another strong month for the SUV segment, with 64,052 new vehicles registered as sold to top last year’s figures by 29.0% and increase its market share to 57.9% overall.
Meanwhile, all the other segments also experienced growth, with light commercial (23,793, +6.9%), passenger (18,611, +6.4%) and heavy commercial vehicles (4,246, +1.8%) all maintaining similar market shares at 21.5%, 16.8% and 3.8%, respectively.
For the third consecutive month, all states and territories experienced growth compared to last year, with New South Wales (35,968, +24.3%), Western Australia (10,577, +22.4%) and Tasmania (1,972, +21.0%) seeing the biggest improvements. The Northern Territory (862, +3.6%) was the only state or territory to experience less than 10% growth.
Market sales: September 2023
| Category | September sales | % change vs 2022 | Market share % |
| SUV | 64,052 | 29.0 | 57.9 |
| Light commercial | 23,793 | 6.9 | 21.5 |
| Passenger | 18,611 | 6.4 | 16.8 |
| Heavy commercial | 4,246 | 1.8 | 3.8 |
Vehicle sales by state or territory: September 2023
| State/territory | September sales | % change vs 2022 |
| New South Wales | 35,968 | 24.3 |
| Victoria | 29,426 | 16.0 |
| Queensland | 23,415 | 13.5 |
| Western Australia | 10,577 | 22.4 |
| South Australia | 6,676 | 11.2 |
| Tasmania | 1,972 | 21.0 |
| Australian Capital Territory | 1,806 | 20.6 |
| Northern Territory | 862 | 3.6 |
Vehicle brands: September

It was a return to normalcy for market juggernaut Toyota, recording 20,912 new car sales across September to stamp its authority on the industry once more. This result was 40.8% higher than at the same stage last year, marking the second straight month of growth after an extended period lagging behind 2022’s numbers.
Mazda edged out Ford by just 16 vehicles, with the Japanese manufacturer (8,031, +10.6%) keeping its grip on second place in the best-sellers’ list despite the American brand (8,015, +20.8%) closing the gap significantly.
Kia (7,303, +0.2%) and Hyundai (6,217, -4.4%) sat slightly further back to round out the top five, neither of which saw much change from their numbers in September 2022.
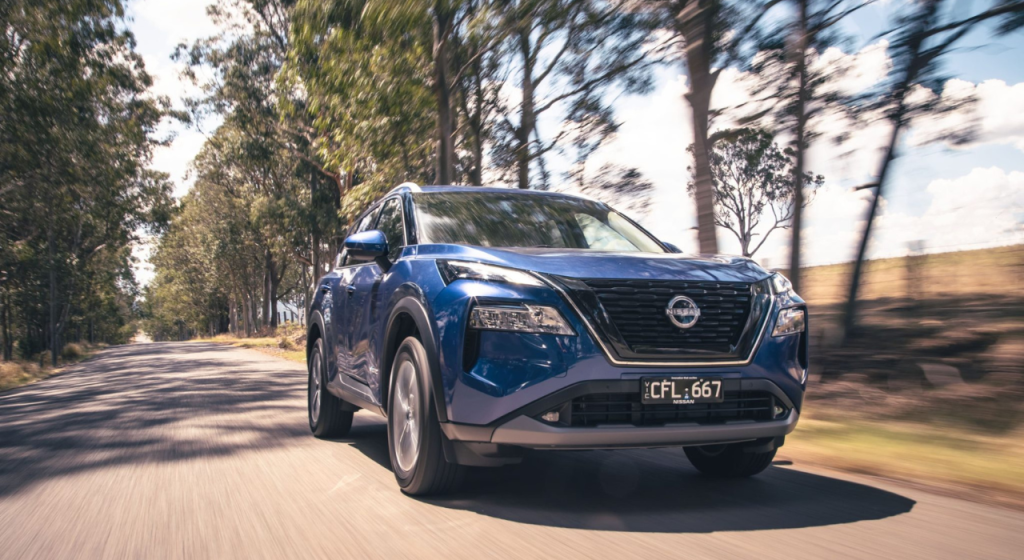
MG continued its strong performance across the year with 5,400 new registrations, marking an increase of 65.6%, while Nissan saw a massive jump of 153.8% off the back of its 4,784 cars sold, which was enough to earn ninth spot on the monthly leaderboard.
Mitsubishi (5,761, -15.1%) and Tesla (5,177, -13.3%) both took a hit compared to last year’s figures, while Subaru (4,302, +35.8%) saw a nice bump to complete the top ten.
There was only one change to the makeup of this list, as Isuzu Ute fell to 12th overall despite recording 3,932 new car registrations and a very healthy increase of 39.5%.
Toyota also leads the way in terms of YTD sales, although its total of 154,659 after the first three quarters of 2023 still sits 12.3% behind where it was last year. At less than half its tally is Mazda, which stayed comfortably out in front of the rest of the chasing pack with 75,220.
Third-placed Ford increased its gap on Kia to sit at 61,204 so far, which is 34.6% ahead of the same stage last year. Meanwhile, Kia (59,123, -1.8%) and Hyundai (56,958, -2.0%) both remain slightly down on the previous year.
Despite its monthly decrease, Tesla is still 171.0% clear of where it was last year (albeit this is down from a 307.6% lead at the end of last month), while Subaru (+35.1%) and MG (+26.4%) are also up compared to the same point in 2022.
Best-selling vehicle brands: September 2023
| Brand | September sales | % change vs 2022 |
| Toyota | 20,912 | 40.8 |
| Mazda | 8,031 | 10.6 |
| Ford | 8,015 | 20.8 |
| Kia | 7,303 | 0.2 |
| Hyundai | 6,217 | -4.4 |
| Mitsubishi | 5,761 | -15.1 |
| MG | 5,400 | 65.6 |
| Tesla | 5,177 | -13.3 |
| Nissan | 4,784 | 153.8 |
| Subaru | 4,302 | 35.8 |
| Volkswagen | 4,184 | 13.1 |
| Isuzu Ute | 3,932 | 39.5 |
| GWM | 2,897 | -5.0 |
| BMW | 2,354 | 15.8 |
| Mercedes-Benz | 2,031 | -23.2 |
Best-selling vehicle brands: YTD 2023
| Brand | 2023 sales | % change vs 2022 |
| Toyota | 154,659 | -12.3 |
| Mazda | 75,220 | 1.8 |
| Ford | 61,204 | 34.6 |
| Kia | 59,123 | -1.8 |
| Hyundai | 56,958 | -2.0 |
| Mitsubishi | 45,714 | -24.5 |
| MG | 42,807 | 26.4 |
| Tesla | 37,997 | 171.0 |
| Subaru | 35,063 | 35.1 |
| Isuzu Ute | 32,341 | 19.1 |
Vehicle models: September

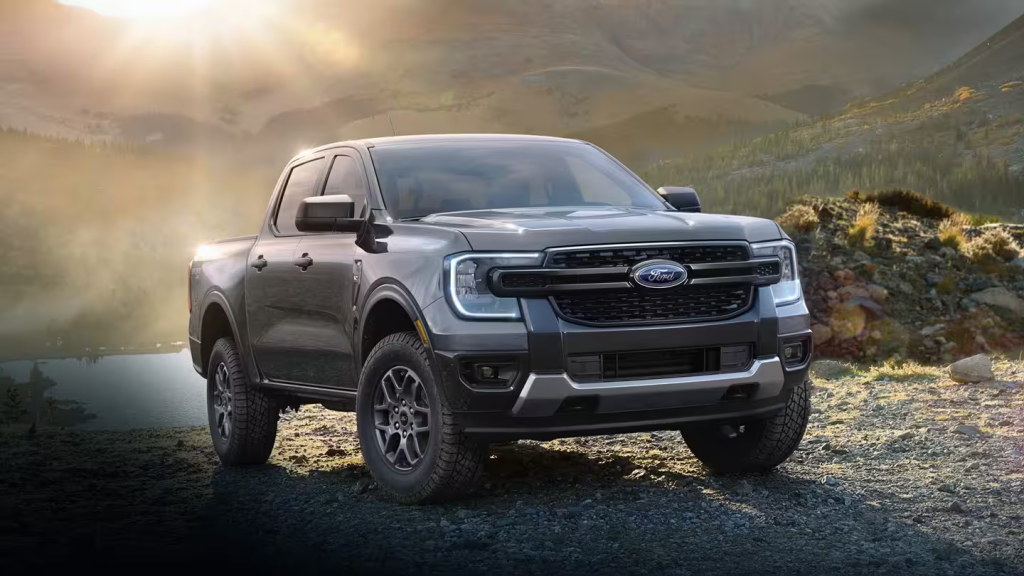
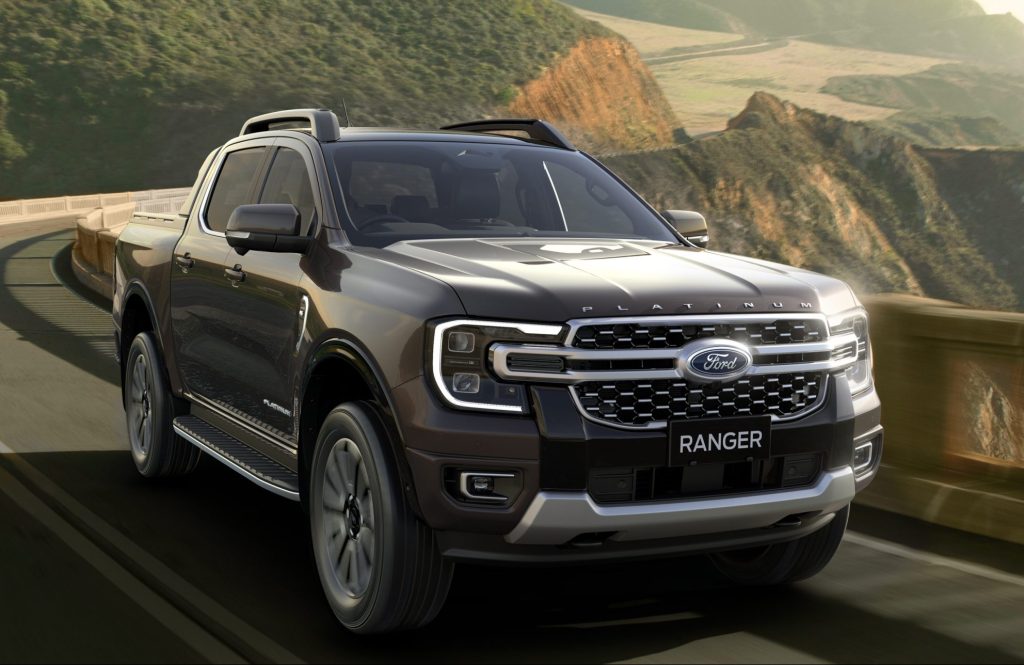
After a battle which was decided by just two units last month, the Toyota HiLux took out top honours for the month by a far less slender margin over the Ford Ranger. The HiLux’s 5,776 represented an increase of 11.7%, while the Ranger’s 5,429 came at an 11.0% rise.
Tesla’s Model Y jumped back up to third for the month after it slid back down the best-sellers’ list in August, albeit with its 3,811 new registrations coming in at 12.6% lower than last year.
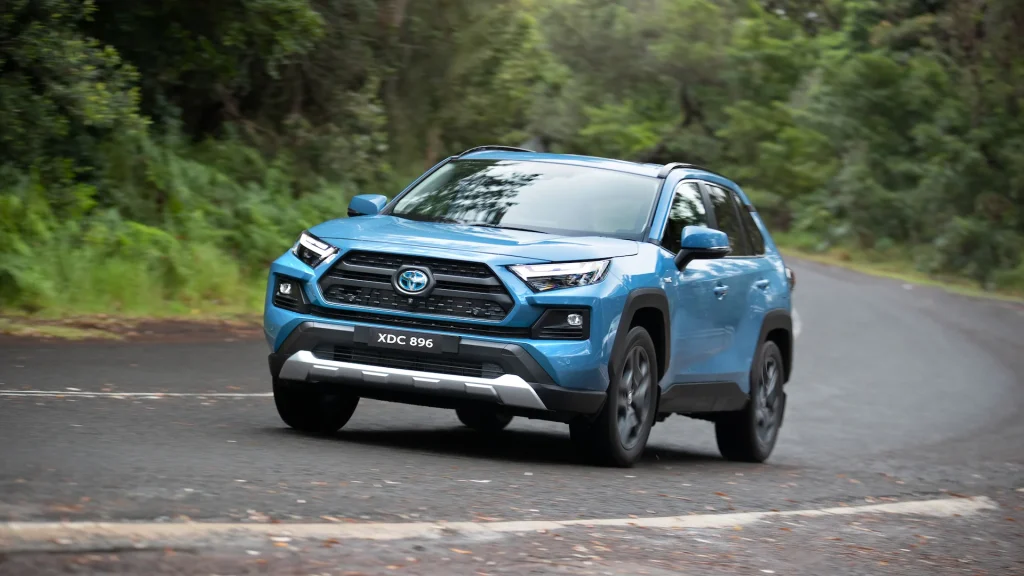
There were no such issues for the bulk of the rest of the top ten, with the Isuzu Ute D-Max (2,885) and Toyota RAV4 (2,798) completing the top five with increases of 49.9% and 50.8%, respectively.
The Mitsubishi Outlander (2,612, +39.0%) and Toyota Corolla (2,217, +42.7%) both also enjoyed handy boosts, but the biggest mover was the MG ZS, which powered to an increase of 154.3%. Its monthly total of 2,528 saw it slot into seventh overall.
A new member of the top ten for the month was the Ford Everest, which sneaked into tenth spot with 1,984 at a mammoth increase of 147.7%, while the Kia Sportage also joined the party (2,031, +14.4%).
The HiLux has increased its lead at the top of the YTD sales charts to over 1,000 units entering the last three months of the year, clinching favouritism over the Ranger on the home stretch.
It’s daylight between the two-horse race at the top and the rest of the pack, but the Model Y’s solid month was enough to knock the ZS out of the top three, albeit by just over 300 units.
There were no other changes to the top ten from last month, but it remains tight in the bottom half of the table. The Mazda CX-5, Hyundai i30 and Hyundai Tucson are all separated by just over 700 vehicle sales, making for an interesting watch across the remainder of 2022.
Best-selling vehicle models: September 2023
| Model | September sales | % change vs 2022 |
| Toyota HiLux | 5,776 | 11.7 |
| Ford Ranger | 5,429 | 11.0 |
| Tesla Model Y | 3,811 | -12.6 |
| Isuzu Ute D-Max | 2,885 | 49.9 |
| Toyota RAV4 | 2,798 | 50.8 |
| Mitsubishi Outlander | 2,612 | 39.0 |
| MG ZS | 2,528 | 154.3 |
| Toyota Corolla | 2,217 | 42.7 |
| Kia Sportage | 2,031 | 14.4 |
| Ford Everest | 1,984 | 147.7 |
Best-selling vehicle models: YTD 2023
| Brand | 2023 sales | % change vs 2022 |
| Toyota HiLux | 44,301 | -11.0 |
| Ford Ranger | 43,073 | 34.1 |
| Tesla Model Y | 23,457 | 336.3 |
| MG ZS | 23,152 | 64.6 |
| Toyota RAV4 | 22,388 | -17.5 |
| Isuzu Ute D-Max | 21,479 | 11.6 |
| Mitsubishi Outlander | 17,762 | 26.9 |
| Mazda CX-5 | 16,895 | -20.0 |
| Hyundai i30 | 16,492 | -4.2 |
| Hyundai Tucson | 16,173 | 26.0 |


