Although the growth is marginal compared to recent months, the 86,878 vehicles listed as sold represent a 1.8% increase on 2022’s numbers over the same period, becoming the eighth successive month which exceeded the corresponding window in the previous year.
The current streak started last July (+0.4%) and continued on into August (+17.3%), September (+12.3%), October (+16.9%), November (+17.9%), December (+12.1%) and January (+11.9%) in what has become a recent hot streak for the industry as it looks to rebound from the impacts of the pandemic.
It was another big month for electric, hybrid and plug-in hybrid vehicles, which combined for a total of 12,102, or 13.9% of the vehicles sold in February. It was especially promising for EVs, which accounted for 6.8% (5,932) on their own, led in large part by the Tesla Model 3. They outsold hybrids (5,716), though plug-in hybrids (454) brought the total just above those of EVs.
SUVs experienced a slight increase in their market share, with the 47,888 sold making up 55.1% of all sales across the month. It was also an increase of 6.6% compared to the same month last year, with passenger vehicle numbers also growing by 4.8% to 16,435 (18.9% market share).
Heavy commercial vehicles enjoyed a healthy month, which saw a 26.4% increase compared to last February’s sales to finish at 3,805 and a market share of 4.4%. However, light commercial vehicle sales were 13.6% lower than in 2022, with its market share dropping slightly to 21.6%.
It was also a mixed bag for sales across the states and territories, with Western Australia (9,815, +16.7%) the biggest upward movers alongside the ACT (1,454, +7.2%) and New South Wales (27,600, +4.7%), but Tasmania (1,414, -9.4%), South Australia (5,549, -4.5%) and Queensland (18,427, -2.8%) all recorded decreases compared to last year.
Market sales: February 2023
| Category | February sales | % change vs 2022 | Market share % |
| SUV | 47,888 | 6.6 | 55.1 |
| Light commercial | 18,750 | -13.6 | 21.6 |
| Passenger | 16,435 | 4.8 | 18.9 |
| Heavy commercial | 3,805 | 26.4 | 4.4 |
Vehicle sales by state or territory: February 2023
| State/territory | February sales | % change vs 2022 |
| New South Wales | 27,600 | 4.7 |
| Victoria | 21,894 | -1.3 |
| Queensland | 18,427 | -2.8 |
| Western Australia | 9,815 | 16.7 |
| South Australia | 5,549 | -4.5 |
| Australian Capital Territory | 1,454 | 7.2 |
| Tasmania | 1,414 | -9.4 |
| Northern Territory | 725 | 2.8 |

Vehicle brands: February
As is customary, Toyota once again was the most dominant force in the Australian vehicle market, registering 14,332 vehicles sold across February, though at a 13.4% loss compared to the same period in 2022. This follows last month’s numbers, where it also led all comers despite selling 12.8% fewer models.
There were no changes in the top ten from January to February, with each manufacturer holding its place for a successive month. This meant that Mazda sat in second place thanks to its 7,667 units shifted (-12.7%), ahead of third-placed Ford (6,022, +30.6%), which itself pipped Kia by 22 cars (6,000, +2.0%).
Hyundai rounded out the top five by an even closer margin, with its 5,504 vehicles sold (-2.6%) just four more than Mitsubishi’s 5,500 (-29.6%). MG (4,363, +15.8%) and Subaru (4,054, +28.7%) both also saw handy growth among the best sellers.
Tesla held its place among the top ten with 3,516 cars sold across the month and continued to dominate the electric vehicle market, making it the highest-ranking pure EV make for the second month running.
Outside the top ten, Volkswagen experienced healthy growth of 65.9% (2,930), while GWM and Audi both more than doubled their numbers over the corresponding month in 2022 with 2,353 (+188.4%) and 1,680 (+126.4%), respectively, pushing them ahead of big names such as Mercedes-Benz, Suzuki and BMW.
Best-selling vehicle brands: February 2023
| Brand | February sales | % change vs 2022 |
| Toyota | 14,332 | -13.4 |
| Mazda | 7,667 | -12.7 |
| Ford | 6,022 | 30.6 |
| Kia | 6,000 | 2.0 |
| Hyundai | 5,504 | -2.6 |
| Mitsubishi | 5,500 | -29.6 |
| MG | 4,363 | 15.8 |
| Subaru | 4,054 | 28.7 |
| Tesla | 3,516 | N/A |
| Isuzu Ute | 3,156 | 13.3 |
| Volkswagen | 2,930 | 65.9 |
| Nissan | 2,573 | -8.8 |
| GWM | 2,353 | 188.4 |
| Audi | 1,680 | 126.4 |
| LDV | 1,480 | 48.3 |
Best-selling vehicle brands: YTD 2023
| Brand | 2023 sales | % change vs 2022 |
| Toyota | 27,695 | -23.5 |
| Mazda | 17,074 | -8.1 |
| Ford | 12,646 | 38.4 |
| Kia | 12,006 | 5.3 |
| Hyundai | 11,313 | 5.0 |
| Mitsubishi | 10,776 | -24.9 |
| MG | 8,378 | 14.9 |
| Subaru | 7,655 | 30.3 |
| Tesla | 6,829 | N/A |
| Isuzu Ute | 5,827 | 5.9 |
Vehicle models: February
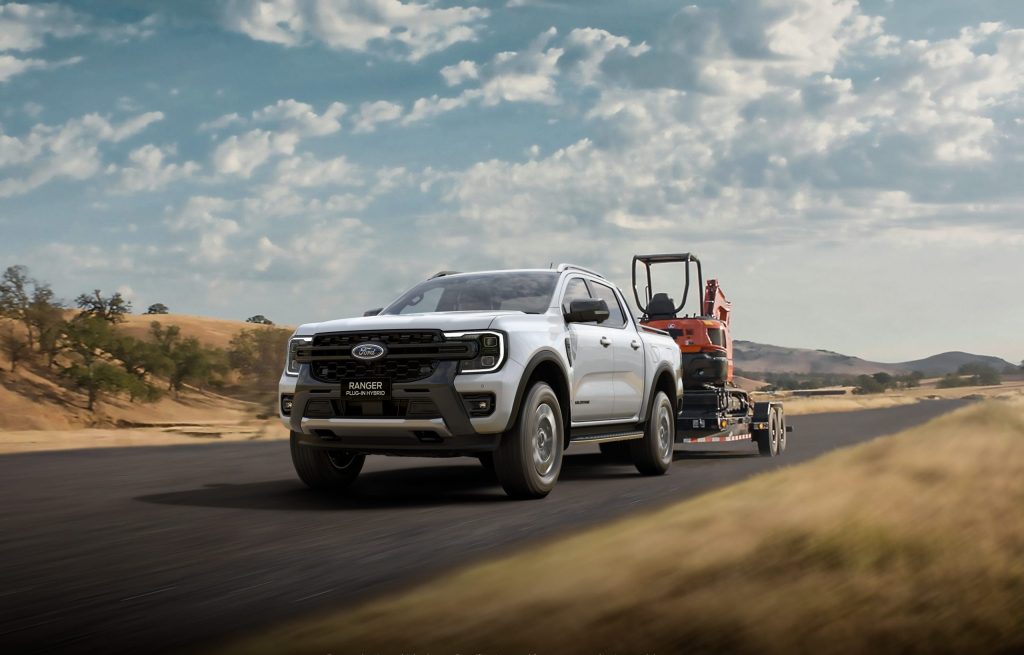
For the second month running, the Ford Ranger topped the individual model sales charts, registering 4,473 new car sales across February to represent a 29.5% increase compared to 2022 and, crucially, a handy buffer on its biggest rival, the Toyota HiLux.
The HiLux’s numbers continue to lag behind those of last year due in part to stock shortages, but they still managed to outsell all bar the Ranger with 3,939 units shifted across the month, albeit at a rate of 18.0% less than in 2022.
After becoming the first model to do so last month, the Tesla Model 3 backed it up in February with successive top-three finishes, this time with 2,671 new cars sold. It just beat out the rising Mazda CX-5, which managed to sell 2,600 new cars at an increase of 105.5% compared to last year.
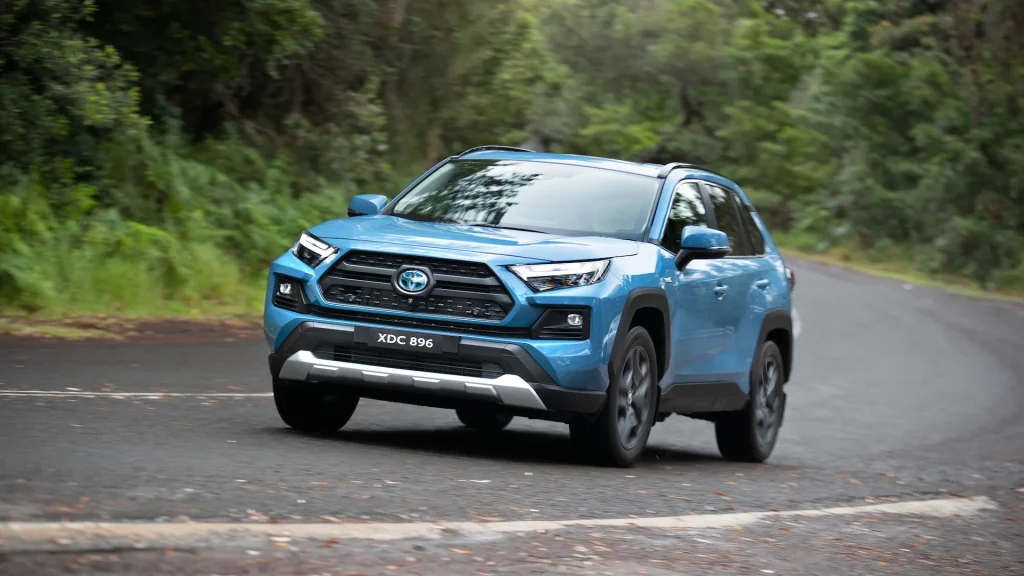
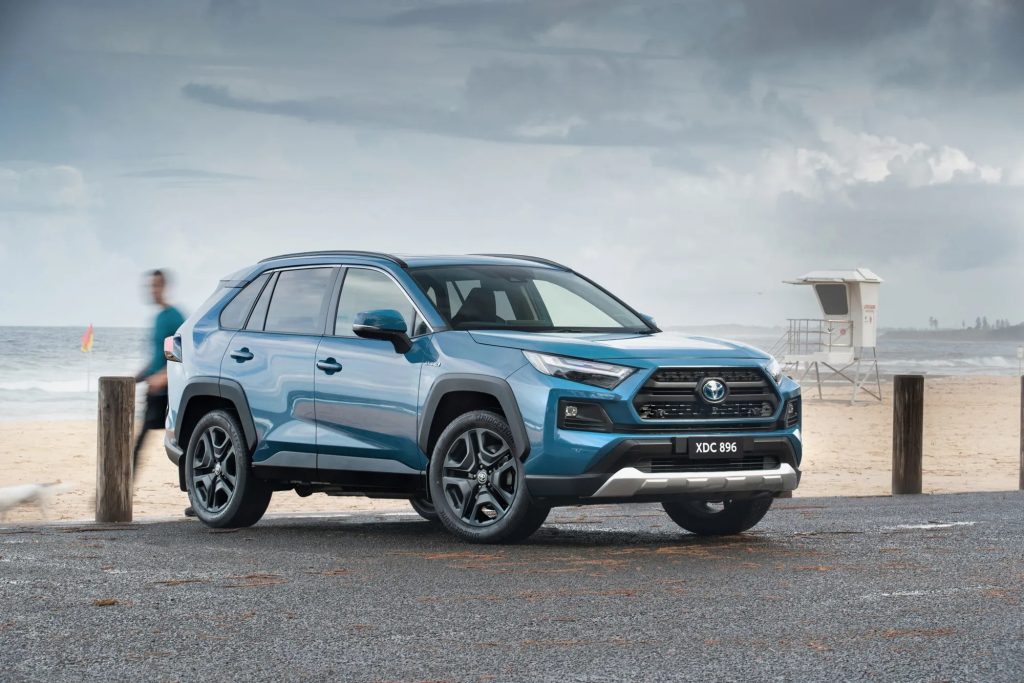
The Mitsubishi Outlander rounded out the top five with 2,166 vehicles sold (+29.5%) to beat the Toyota RAV4 by just 51 cars. The RAV4’s sales numbers were more than half those of February 2022, in which it was the best-selling vehicle by almost 900 units ahead of the HiLux.
MG had two entrants in the top ten (only Toyota also had more than one), with the ZS finishing seventh with 2,047 (+4.8%) and the MG 3 rocketing into the best seller’s list with 1,622 (+12.9%). Also joining the party was the Subaru Forester, which racked up 1,709 new car sales, 35.9% more than last year.
Best-selling vehicle models: February 2023
| Model | February sales | % change vs 2022 |
| Ford Ranger | 4,473 | 29.5 |
| Toyota HiLux | 3,939 | -18.0 |
| Tesla Model 3 | 2,671 | N/A |
| Mazda CX-5 | 2,600 | 105.5 |
| Mitsubishi Outlander | 2,166 | 29.5 |
| Toyota RAV4 | 2,115 | -52.5 |
| MG ZS | 2,047 | 4.8 |
| Isuzu Ute D-Max | 1,931 | 0.0 |
| Subaru Forester | 1,709 | 35.9 |
| MG 3 | 1,622 | 12.9 |